It is important to understand that the Curtis Bay Piers facility is located in a heavily industrialized area surrounded by a variety of other permitted industries. Investments have been made to advance long-term operational safety, improve dust control, and collect 100% of storm water for onsite reuse at our facility.
The 2022 construction permit added a requirement to implement a Fence Line Monitoring Plan designed to monitor for fugitive dust, or dust that is not emitted from definable point sources.
In 2023, CSX installed a fence line monitoring system to continuously monitor particulate matter along the perimeter of the Curtis Bay Piers property. CSX worked with outside consultants and the Maryland Department of Environment (MDE) to ensure the fence line monitoring system met or exceeded permitting and agency requirements. Fence line monitoring is a way to gather information and quantify the amount of particulate matter in the vicinity of the facility. Air monitoring data creates a “map” of air quality measured at the fence line, which can be used by CSX, MDE, and the community to help understand air quality conditions surrounding the Curtis Bay Piers facility.
CSX utilizes multiple control measures to mitigate dust from operations, including an automated dust suppression system with water sprayers.
How to Read the Data?
- Measurement data are displayed as the Air Quality Index (AQI) based on a 24-hour rolling average.
- Hover your mouse over a monitor location to view the 24-hour rolling average data for PM2.5 and PM10.
- Detailed PM2.5 and PM10 24-hour data are graphed in µg/m3 units.
- The arrow displayed at the monitor location indicates the current wind direction.
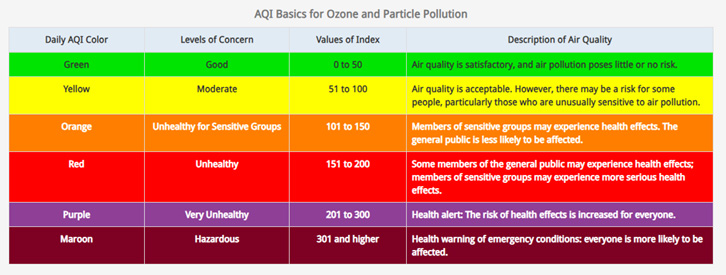
- Data is color coded as the current AQI value in accordance with EPA standards (see image below).
- While these fence line monitors measure air quality around the perimeter of the facility, they are not able to attribute a specific source for high AQI values.
A grey colored location indicates equipment maintenance needed.
Disclaimer: We are sharing this real time data before it has gone through the full state agency and technical quality assurance review. The data published on this site is provided in real time to communicate the current outdoor air quality conditions to the community. Although preliminary data quality checks are performed, the data presented on this page are not fully verified and validated through the quality assurance procedures defined in the Quality Assurance Project Plan (QAPP) that was developed for this monitoring network and accepted by MDE.
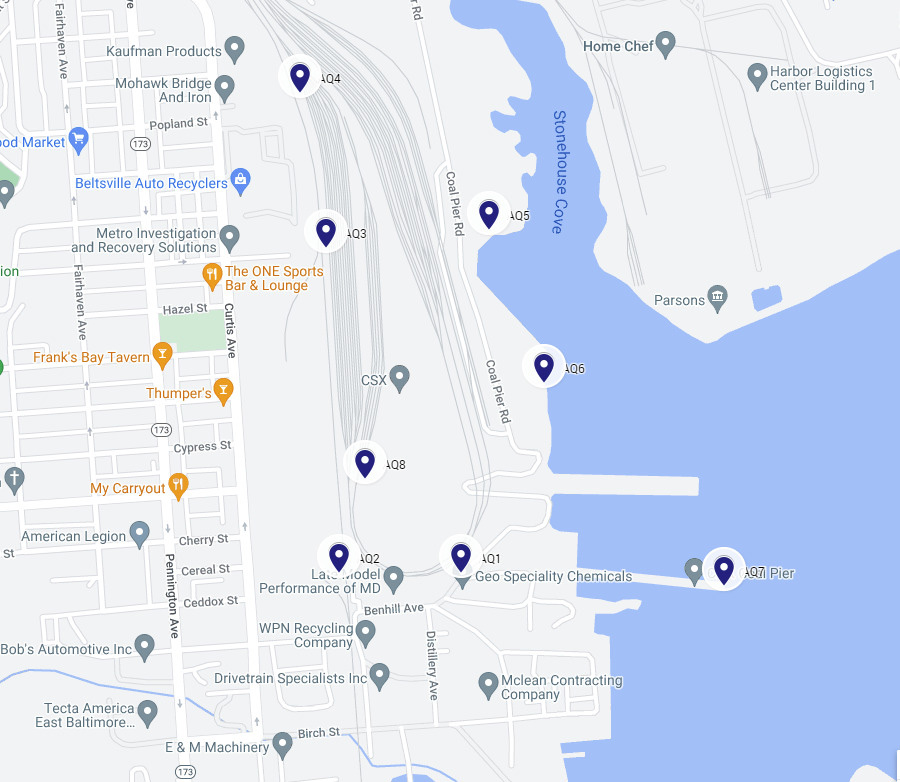
Fence Line Locations at Curtis Bay Piers
- Eight (8) onsite monitoring locations were selected along the perimeter of the Curtis Bay Piers operating areas in accordance with U.S. Environmental Protection Agency (EPA) site selection criteria and to continuously collect data for inbound and outbound wind scenarios.
- The monitor locations are numbered AQ1 through AQ8. The first monitor, AQ1, is located at the southeastern boundary of the facility, near the Benhill Avenue gate. The remaining locations are numbered in a clockwise direction from AQ1 around the perimeter. The last monitor, AQ8, is located west of the transfer tower, and in line with Church Street.
Learn more about the monitoring equipment in use at Curtis Bay Piers
- The Fence Line Monitoring System is required to include:
- One (1) continuous federal equivalent method (FEM) monitor for both PM2.5 and PM10 and at least one (1) collocated PM2.5/PM10 sensor.
- To improve understanding of PM concentrations on both the east and west sides of the facility, and to increase confidence in the measurements from the monitoring network, CSX has installed two (2) FEM monitors: one at AQ5 and one at AQ8.
- Multiple PM2.5 /PM10 sensors around the CSX property.
- CSX has installed ten Modulair sensors across the eight fence line locations. Four sensors are collocated with one of the FEM stations and six sensors make up the remaining independent sites in the network.
- Sensors are continuously collocated with the FEM monitors to provide additional quality assurance and quality control checks to better understand and qualify measurements made by the Modulair sensors.
- Wind speed and direction are reported at each monitor location to understand the hyper local wind patterns.
- A 10-meter meteorological monitoring system.
- Temperature, relative humidity, wind speed and wind direction, barometric pressure, and precipitation are measured continuously at location AQ5.
- The tower meets EPA’s site selection criteria to reduce interference from structures, influence from artificial heat sources and is representative of the Curtis Bay area.
- Data from the 10-meter meteorological tower is shared publicly at MesoWest.
- One (1) continuous federal equivalent method (FEM) monitor for both PM2.5 and PM10 and at least one (1) collocated PM2.5/PM10 sensor.
- Federal Equivalent Method (FEM) Monitor
- EPA has established that air monitoring equipment used for comparison to the National Ambient Air Quality Standards (NAAQS) must be designed and tested to meet rigorous performance criteria for obtaining reliable and repeatable measurements to meet either Federal Reference Methods (FRMs) or Federal Equivalent Methods (FEMs). Continuous measurements for PM are only accomplished using FEM monitors.
- CSX has installed Teledyne API T640X monitors at two locations (AQ5 and AQ8) around the Curtis Bay Piers property.
- The Teledyne API T640, with the 640X option, is a real-time, continuous particulate matter (PM) mass monitor that uses scattered light spectrometry for measurement of PM2.5 and PM10. The T640X is designated by EPA as an FEM for making measurements of both PM2.5 (FEM designation #: EQPM-0516-238) and PM10 (FEM designation #: EQPM-0516-239).
- FEM monitors go through monthly maintenance and quality control testing, which is considered by EPA to be a critical test for accuracy and reliability.
- Low cost sensor technology
- A low-cost air pollution monitor is a device that uses one or more sensors to detect, monitor and report on specific air pollutants like particulate matter and environmental factors such as temperature, humidity, wind speed, and wind direction.
- CSX is utilizing low-cost sensor technology, manufactured by QuantAQ Modulair, to satisfy the fence line monitoring system requirements for measuring both PM2.5 and PM10.
- Sensors have been installed at all eight locations around the terminal property with four sensors continuously collocated with the two FEM monitors.
- The continuous collocation helps provide additional quality assurance and control checks of the sensors, improving the understanding of how atmospheric conditions affect the sensors and enhancing data quality.
- This approach reduces erroneous measurements and data spikes.
- Network Operation
- CSX implements a quality assurance program that is defined in a Quality Assurance Project Plan (QAPP) that was reviewed and approved by MDE.
- The procedures defined in the QAPP ensure that equipment is operated within acceptable tolerances to report data that reflects reasonably accurate results.
- The quality assurance procedures follow the U.S. EPA guidance and performance standards.
- On-site activities include monthly site visits for maintenance and testing of the air quality sensors and monitoring equipment.
- CSX implements a quality assurance program that is defined in a Quality Assurance Project Plan (QAPP) that was reviewed and approved by MDE.
Air Quality Background Information and Definitions
Air Pollutants Explained
- Particulate Matter
- Particulate matter (PM) is the term for a mixture of solid particles and liquid droplets found in the air. Some particles, such as dust, dirt, soot, or smoke, are large or dark enough to be seen with the naked eye. Others are so small they can only be detected using an electron microscope.
- Particle pollution includes:
- PM10: inhalable particles, with diameters that are generally 10 micrometers and smaller; and
- PM2.5: fine inhalable particles, with diameters that are generally 2.5 micrometers and smaller.
Sources of Particulate Matter
- Particulate matter comes in many sizes and shapes and can be made up of hundreds of different elements and compounds.
- Some particles are emitted directly from a source, such as construction sites, unpaved roads, fields, smokestacks or fires.
- Most particles form in the atmosphere as a result of complex reactions of chemicals such as sulfur dioxide and nitrogen oxides, which are pollutants emitted from automobiles, power plants, and other industries.
- Natural sources of PM include pollen, soils, fires, animals, and other anthropogenic sources.
- Common community sources of PM include fireplaces, grills, cars and trucks, fuel powered lawn equipment, natural gas furnaces, water heaters, and fireworks.
National Ambient Air Quality Standards
- The Clean Air Act requires EPA to set National Ambient Air Quality Standards (NAAQS) for six principal pollutants which can be harmful to public health and the environment.
- Primary standards provide public health protection, including protecting the health of “sensitive” populations such as asthmatics, children, and the elderly.
- Secondary standards provide public welfare protection, including protection against decreased visibility and damage to animals, crops, vegetation, and buildings.
- A list of the current NAAQS can be found here: NAAQS Table | epa.gov.
- PM10 and PM2.5 are both listed as criteria pollutants and have a corresponding standard.
- In 2024, EPA revised the Primary PM2.5 annual standard from 12 ug/m3 to 9.0 ug/m3.
Air Quality Index via AirNow.gov
- EPA and State Air Monitoring Agencies are required to report air quality to the public in a nationally and easy to understand manner. EPA developed the Air Quality Index (AQI), which converts concentrations of pollutants into a uniform scale from 0 to 500. Based on measurements of different criteria pollutants (including particulate matter), the index provides an instant value, descriptive classification, and color-coded scale to represent the current air quality conditions.
- Reference: AQI Basics | AirNow.gov
- AirNow is a source for air quality data from EPA, state, local, and tribal agencies reported as the U.S. Air Quality Index (AQI), a color-coded index designed to communicate whether air quality is healthy or unhealthy for you.
- Reference: Air Now Index (AQI) Basics
- The Maryland Department of the Environment publishes regional AQI data on its website.
- The AQI for both PM2.5 and PM10 is based on the 24-hour rolling average of hourly concentrations.
Air Transport
- Air transport refers to pollution from upwind emission sources that impact air quality in a given location downwind. The particulates traveling through the atmosphere impacting the community can come from a variety of different sources – some from hundreds of miles away.
- For example, NASA watches millions of tons of dust that is transported in the atmosphere from northwest Africa across the Atlantic Ocean onto the soils of America each year. It’s a visual reminder of how Earth’s systems are interconnected.
- A more recent and local example is the 2023 Canadian fires, which resulted in local air quality being affected by smoke from wildfires that was transported thousands of miles from the origin of the fires.
- During the wildfire events, the Maryland Department of Health used air quality measurements similar to those being done by CSX and the AQI to communicate and urge people to be aware of the risks of poor air quality. Maryland Department of Health, Department of the Environment urge Marylanders to take precautions due to Code Red-level unhealthy air quality across the state
- Within a city, the air quality can vary greatly, and sources of pollution can stem from a variety of sources, including mobiles sources (cars, trucks, and locomotives), fireplaces, grills, fuel powered lawn equipment, furnaces, water heaters, fireworks, natural sources, and industrial sources.
- Atypical events (natural disasters, wildfires, or high wind events, and increases in automotive emissions) can cause short-term elevated spikes in air pollution measurements.